Every cost per lead calculator makes the same assumption: divide what you spent by the leads it produced and you have your number. That number only holds if somebody worked every lead, and almost nobody does.
You pay $41.67 for an inquiry. Because 7 in every 10 never get a reply, each inquiry someone actually answers costs you $138.89, which is 3.3 times more. That gap is not a marketing problem. Those people contacted you, and nobody got back to them.
See how to stop losing $42,000 a yearFor general information only. This calculator gives estimates based on the figures you enter and on benchmark averages. It is not financial, accounting, marketing or legal advice. The default reply rate is an average across a sample of 273 businesses and is not a measurement of your business. Where you enter a customer value and a conversion figure, those are your numbers: Rosebud Solutions does not claim a conversion rate, and nothing here is a forecast, a projection, or a representation of what Rosebud or any other provider would achieve. Take professional advice before acting on any figure. Rosebud Global Ltd accepts no liability for reliance placed on this calculator or for any loss arising from its use. Calculations run in your browser. If you choose to email yourself a copy, your email address and the figures you entered are sent to us to deliver that email — nothing else is submitted or stored.
What this calculates, and why it differs from a standard CPL calculator
A conventional cost per lead calculation divides total spend by total leads, which tells you what it costs to make the phone ring and nothing about what happens next. A business paying $41 a lead at a 30% response rate is not paying $41 a lead. It is paying $139 for every lead a human being actually touched, and burning the rest. This is a lead management problem rather than a lead generation one.
The calculator above splits those two figures apart: cost per inquiry generated is the number your agency reports, and cost per inquiry worked is the number your business actually operates on.
Where the benchmark numbers come from
The default response rate is not an estimate. In the 2026 US Service Business Response Study we sent a real inquiry to 273 US owner-operated service businesses across five sectors and recorded what came back.
Of 211 inquiries provably delivered, 29.9% drew any reply within 72 hours and 21.3% drew a reply from a person. 70.1% received nothing at all. A further 20.5% of businesses had no working web inquiry form, so an inquiry could not be submitted in the first place.
Median time to a first reply was 5.1 hours, rising to 8.8 hours counting only replies from a person. Inquiries arriving outside opening hours drew a response 19.8% of the time against 34.8% during them.
That is the benchmark the calculator uses when you do not know your own rate. If you think yours is better, use your own figure. Most businesses guess high, which is itself worth knowing.
How to calculate cost per lead properly
Four figures, and the first two are the ones everybody already has.
Cost per inquiry generated = total monthly marketing and advertising spend ÷ inquiries received. Include agency fees, listing fees and content costs alongside media spend. This is the headline number.
Inquiries actually worked = inquiries received × your response rate. Response rate here means the share that received a reply, not the share that converted.
True cost per worked inquiry = total spend ÷ inquiries actually worked. On a 30% response rate this is more than three times the headline figure.
Wasted spend = total spend × (1 − response rate). This is money that bought an inquiry nobody replied to, which is not a marketing failure, because the marketing did its job and the inquiry arrived.
Worked examples at three spend levels
Same response rate, three different businesses. The proportion lost is identical; the amount is not.
Notice the headline cost per lead improves as spend rises, from $50 to $35.71, which is what a media buyer optimises for and reports on. The true cost per worked inquiry improves at the same rate, and the wasted amount grows in absolute terms. Better acquisition does not fix a response problem; it enlarges it.
At a 60% response rate rather than 30%, the mid-sized business wastes $3,200 a month instead of $5,600. Doubling the response rate halves the waste, and it costs nothing in media spend to do.
What wasted lead spend looks like by sector
Our 2026 study measured two failures separately, and they compound. An inquiry cannot be answered if there was no working form to submit it through.
For a business in that 20.5%, the calculation above understates the problem. Every dollar of demand generation spend that produced a web inquiry produced nothing at all, because the inquiry never arrived.
Why this is not a lead quality problem
Almost every treatment of wasted marketing spend blames the leads themselves: unqualified prospects, poor targeting, junk form fills, bots. Those are real problems, and calculators exist for them.
This is the other kind of waste, and it is less discussed because it is less comfortable. These leads were fine. They found you, they contacted you, and the money that produced them was already spent, and then nobody replied.
The distinction matters because the remedies are opposite. A lead quality problem is fixed upstream, by changing targeting or channel. A response problem is fixed downstream, by changing what happens in the hours after an inquiry lands. Spending more on targeting will not fix a form nobody checks on a Friday evening.
Where the money actually goes
Four failure points, in the order they occur. Each one sits before anything a salesperson could influence.
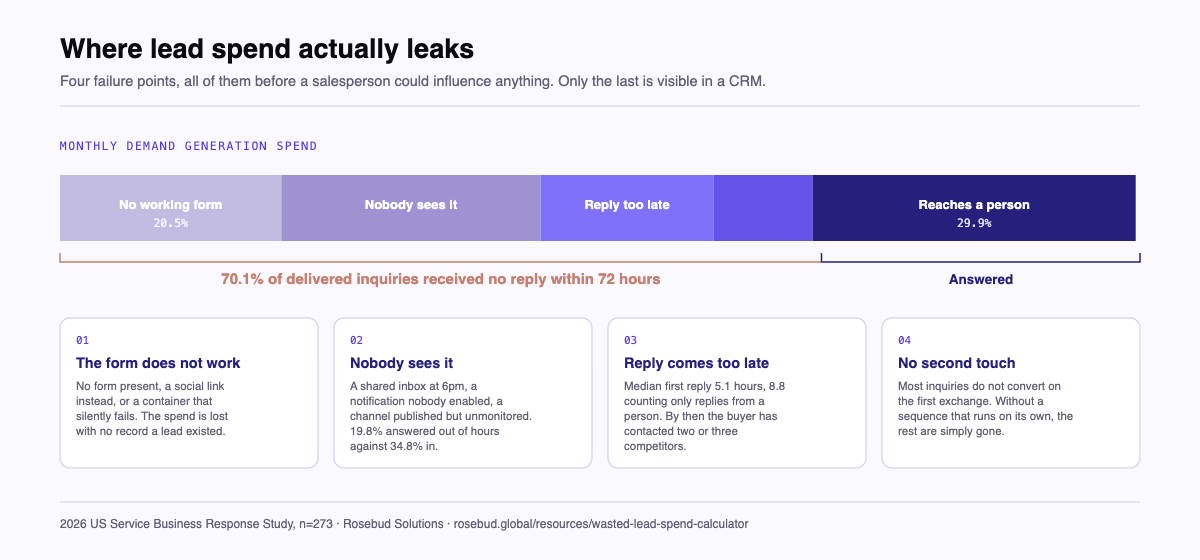
The form does not work. No form present, a social link in place of one, or a submission container that silently fails. One in five businesses in our study. The spend is lost with no record that a lead ever existed, which is why this failure is invisible on every dashboard.
The inquiry arrives and nobody sees it. It lands in a shared inbox at 6pm, or in a notification nobody has enabled, or in a channel the business publishes but does not monitor. Our study found inquiries arriving outside opening hours drew a response 19.8% of the time against 34.8% during them.
Somebody sees it and does not reply in time. Median first reply in the study was 5.1 hours, rising to 8.8 hours counting only replies from a person. By then the buyer has usually contacted two or three competitors.
A reply goes out and there is no second touch. Most inquiries do not convert on the first exchange. Without a follow-up sequence that runs on its own, the ones that did not reply immediately are simply gone.
Only the last of those four is visible in a CRM, which is why the total is almost always larger than a business expects.
What to do with the number
Test your own intake first. Submit a real inquiry through every channel you publish, including the ones you rarely check, from a phone on cellular data rather than the office network, since one business in five finds something broken at this step.
Measure your actual response rate rather than estimating it. Take last month's inquiries and count how many received a reply and how long each took, because the gap between what people assume and what the log shows is usually large.
Then decide where the fix belongs. If most of your spend is buying inquiries nobody answers, the cheapest improvement available is answering them rather than buying more, which is lead management rather than lead generation.